
Cash flow runway projections and radar forecasts are analytical estimates derived from recorded historical burn rates and scheduled obligations. They do not constitute guaranteed financial projections or statutory audit reports.
Navigating Financial Dashboards & Cash Flow Runway
Understanding cash burn rate, runway days, and monitoring monthly income vs. operating expenses.
What You Will Accomplish
Gain instant executive clarity on company survival runway, monthly fixed burn, and net cash trajectory.
- At least one active bank or cash account with reconciled entries
Step-by-Step Instructions
Open Radar Screen
Click 'Cash Radar' or 'Pulse' in the top navigation section.
Review Consolidated Cash
Observe total liquid assets summed across all operational checking and savings accounts.
Inspect Runway in Days
Evaluate the runway gauge calculated from your trailing 90-day average net operating cash burn.
Filter by Period
Toggle between 30-day, 90-day, or Year-to-Date views to isolate seasonal swings.
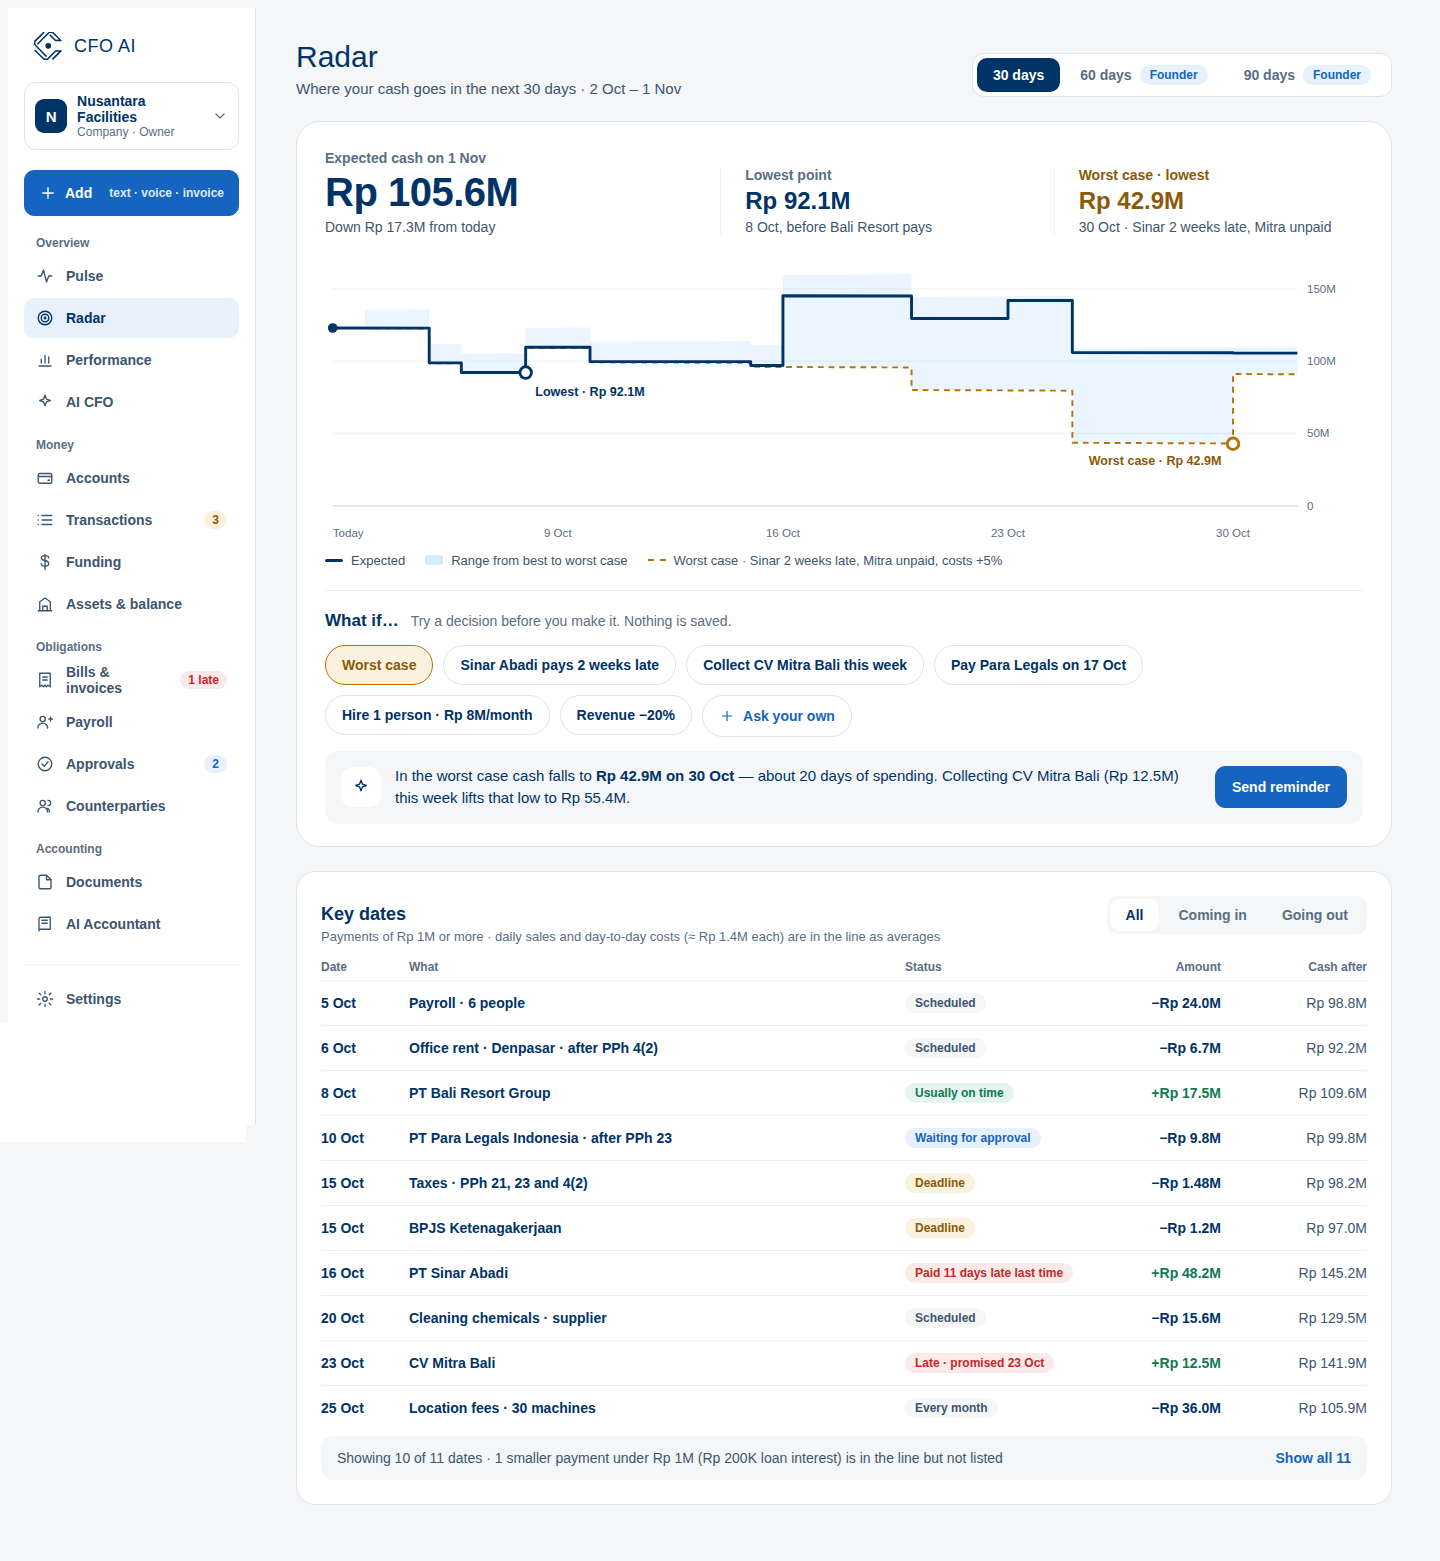
Expected Result
Common Errors & Troubleshooting
Ensure you have at least 14 days of categorized transaction history so the burn rate formula has sufficient baseline data.